Submitting a Rate Calculation
Overview
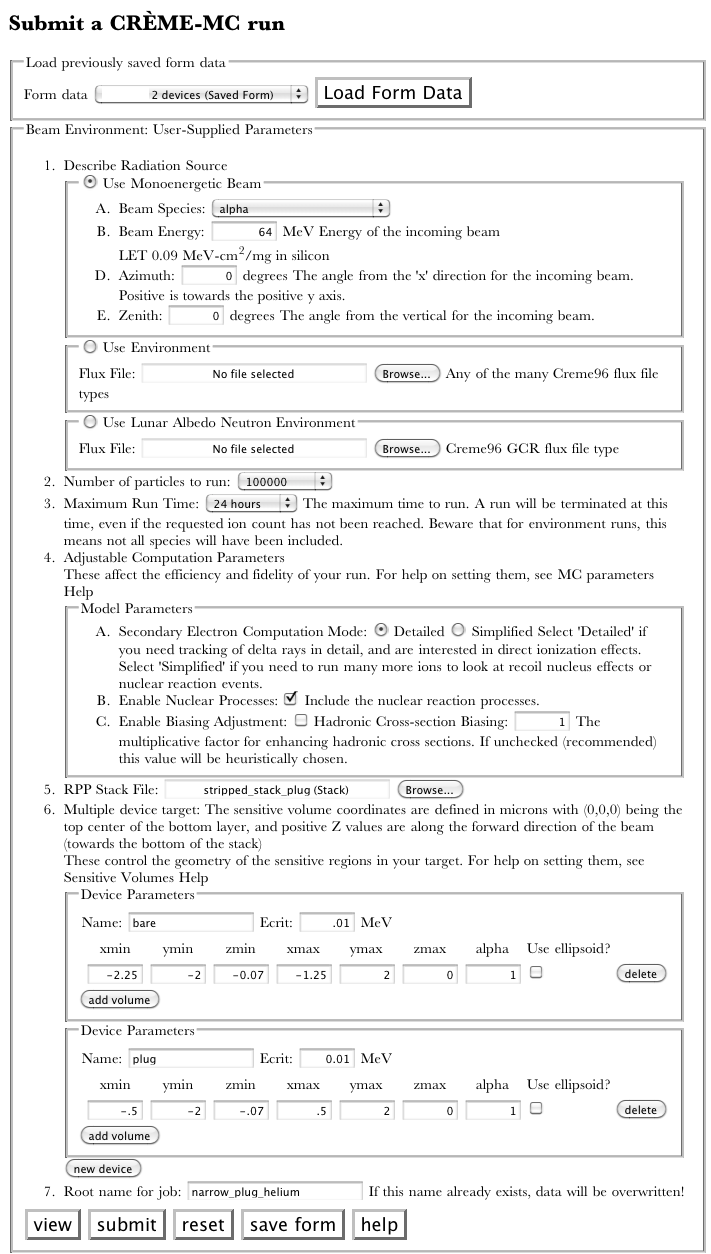
This module performs a monte carlo simulation of an isotropic space environment on a stack structure and sensitive volume.
Inputs
To run the module, you must:
- Select an environment
- Select an RPP stack structure. This file contains information about the composition of materials that exist in the vicinity of a sensitive volume.
- Select the number of particles to simulate. A larger number of particles simulated in a monte carlo calculation provides better statistics of infrequent occurrences but will increase run time accordingly.
- Provide the min and max corners of the sensitive volume. The coordinates are defined with (0,0,0) being the top center of the bottom layer provided by the RPP stack structure, and positive Z values are along the forward direction of the beam. Sensitive volumes are specified in the Multiple Device Target section. Here you may specify the placement and critical energy of more than one device.
Output
The module will submit a simulation job. Once the job has completed, a report will be generated. This report will document the physical processes included in the simulation, beam parameters, a description of the target and sensitive volume placement, followed by the results of the simulation. Within the Calorimetry section, one is presented with a histogram of energy deposited within the device(s). Note that these are both raw values that are dependent on the number of particles sampled. In the following section, the device single event upset rate is obtained by reverse integrating the counts of energy deposition events divided by the flux. For a given critical energy or charge, for example 100 keV, the plot is read as the rate at which a primary particle deposits 100 keV or greater in the sensitive volume. If multiple devices have been specified, the plot will contain multiple histograms. The first histogram tallies counts of energy deposition events in all the devices, subsequent histograms are associated with the individual devices. If multiple devices overlap in space, the energy deposited in the overlap will be counted toward both devices. Depending on the study, this may not be desirable. The multiple device simulation also tracks the number of times a single event deposits more than the critical energy in two or more devices. This is reported as a rate for multiple device upset.
