Tutorial
Overview
In this tutorial, we will demonstrate how to use the site to reproduce simulation results contained in a published IEEE Transactions on Nuclear Science article [WARREN2005]. It will walk you through creating a multi-layered stack structure, representative of the back-end-of-line (BEOL) material found in a microelectronics device. The technology evaluated in the paper is a SEU hardened, 4 Mbit, 10 transistor 3.3 V SRAM. Further, you will irradiate the model with a custom particle beam capturing direct ionization induced by the primary ions, indirect ionization via atomic displacements caused by Coulomb scattering between target atoms and the incident ion, and indirect ionization from nuclear reaction products involving the incident ion and the target nucleus. Last, you will obtain an integral cross-section curve, and investigate the results.
Create the Stacks
After logging into the site, navigate to your home directory my clicking on the "my folder" link. From the "add item" menu, choose folder. Provide a title for the folder, such as "Warren2005". You may additionally choose to provide a description of the folder contents. Select "save". Ensure that the "view" tab is active. You are now viewing the "Warren2005" directory. Notice the "state" menu in the upper left corner indicating the state of the currently viewed item. You may change the state between public and private, either granting or revoking read permission for other users.
Stack A contains passivation ad interconnect layers that are consistent in thickness and composition with the technology under study. While still in your "Warren2005" folder, select "Create Stack" from the left portlet. You should see a single material layer. Ensure that the X and Y dimensions are both 5um. Click the "add" button 9 times such that you see a table consisting of 10 layers. Now enter the following materials and thicknesses associated with Stack A. The layers are ordered from the top of the BEOL down to the last layer representing the silicon substrate.
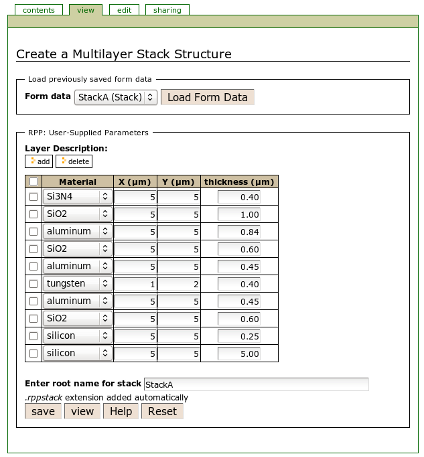
Specify the rootname "StackA" for the output file and click save. Return to your working directory by clicking on the "view" tab. For more information, read Creating a Multilayer Stack Structure
Simulating the Beam
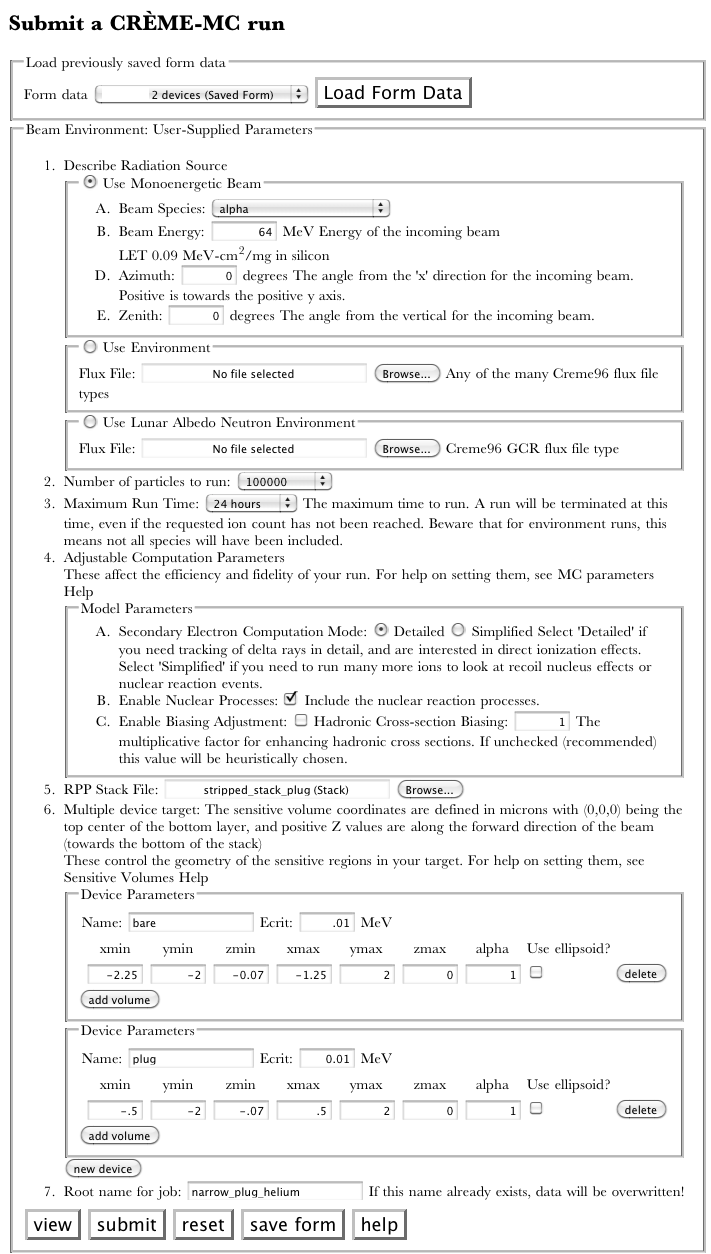
The authors of the paper chose to examine the results of the 523MeV Neon (1.79 MeV-cm2/mg) cross-section as obtained from the Texas A&M Cyclotron Facility.
To run the same test, choose "Run Beam" from the left portlet. Specify the beam species and energy. Then choose the number of particles to simulate. In a physics-based monte carlo simulation code where each incident particle is tracked, the number of particles affects both the counting statistics associated with the results and run time. We will begin by choosing 10000.
Next select the Stack A structure built in the previous section. Additionally, specify the placement of your sensitive volume. Notice that the coordinates are relative to the top-center of the bottom layer. The authors have choosen a sensitive volume of 2.00 x 2.00 x 2.25 um3 located at the top of the 5um silicon layer. Specify the RPP minimum values as -1, -1, 0 and maximum values as 1, 1, 2.25.
Enter the rootname "523MeV Neon on Stack A" and click "submit". You should see a notification at the top of the form indicating that the job has been submitted. Choose the "view" tab. You will now see a folder with your given job name. Click on this folder to view its contents. You will find a single link named "Status of job 523MeV Neon on Stack A". As the job progresses, this link will be updated to reflect the job status. You may use your browser's refresh button to view the updates. For more information read Submitting a Beam Job
Results
When a simulation has finished, the status file will contain one or more "Done.Task" updates, and one final "Done" update. Once the job is "Done", you may once more view the status file to obtain the job results. Click on the "Report Available" link to view the automatically generated reStructuredText file. The report will include the simulation parameters, a description of the stack structure, and a histogram of counts versus deposited energy. Note that you may edit this report to include your own annotations at any time. This report along with all the included images are contained in your job's folder. See Warren2005 Report
If you have XmGrace installed, click on the histogram to download the respective file. Open the "Set Appearance" window and enable "Display error bars" on set G0.S1. These represent the error from counting statistics, not systematic uncertainty in the physics models. Simulating a larger number of particles will decrease the counting error.
| [WARREN2005] | K.M. Warren, R.A. Weller, M.H. Mendenhall, R.A. Reed, D.R. Ball, C.L. Howe, B.D. Olson, M.L. Alles, L.W. Massengill, R.D. Schrimpf, N.F. Haddad, S.E. Doyle, D. McMorrow, J.S. Melinger, and W.T. Lotshaw, "The Contribution of Nuclear Reactions to Heavy Ion Single Event Upset Cross-Section Measurements in a High-Density SEU Hardened SRAM", IEEE Transactions on Nuclear Science, 52, 2125-2131 (2005). |
